How to create a BER County Map Dashboard in Tableau
- Download the free version of Tableau Public or subsciption-based Tableau Desktop
All of the following steps should be possible on the free version of Tableau Public
-
Download a zip file of the BER Public Database
-
Unzip file ( ~ 1 Gb file size )
-
Open Tableau, on the left pane under Connect to a file, click text file, now find the unzipped BER file and click open.
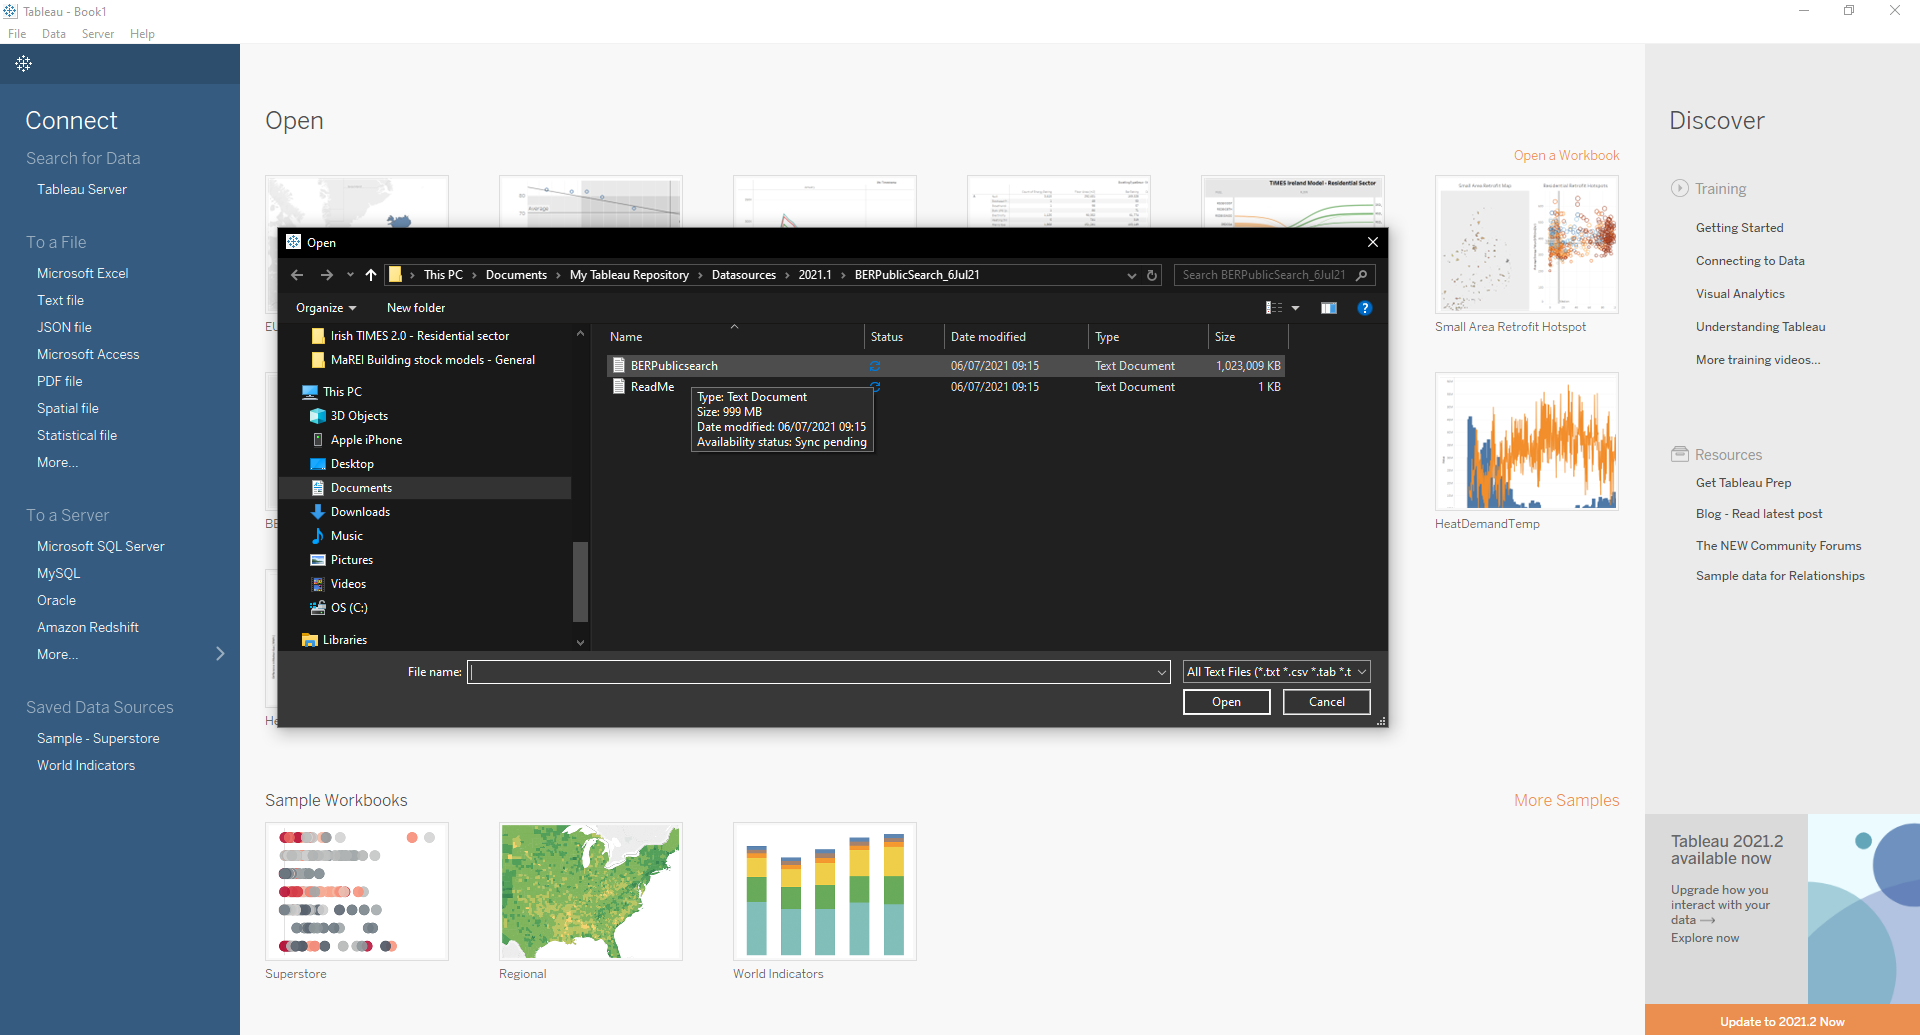
- Click Update in Tableau and file will go into Tableau. Filtering the data is recommend, this can be done on the top right corner of the Data Source tab !

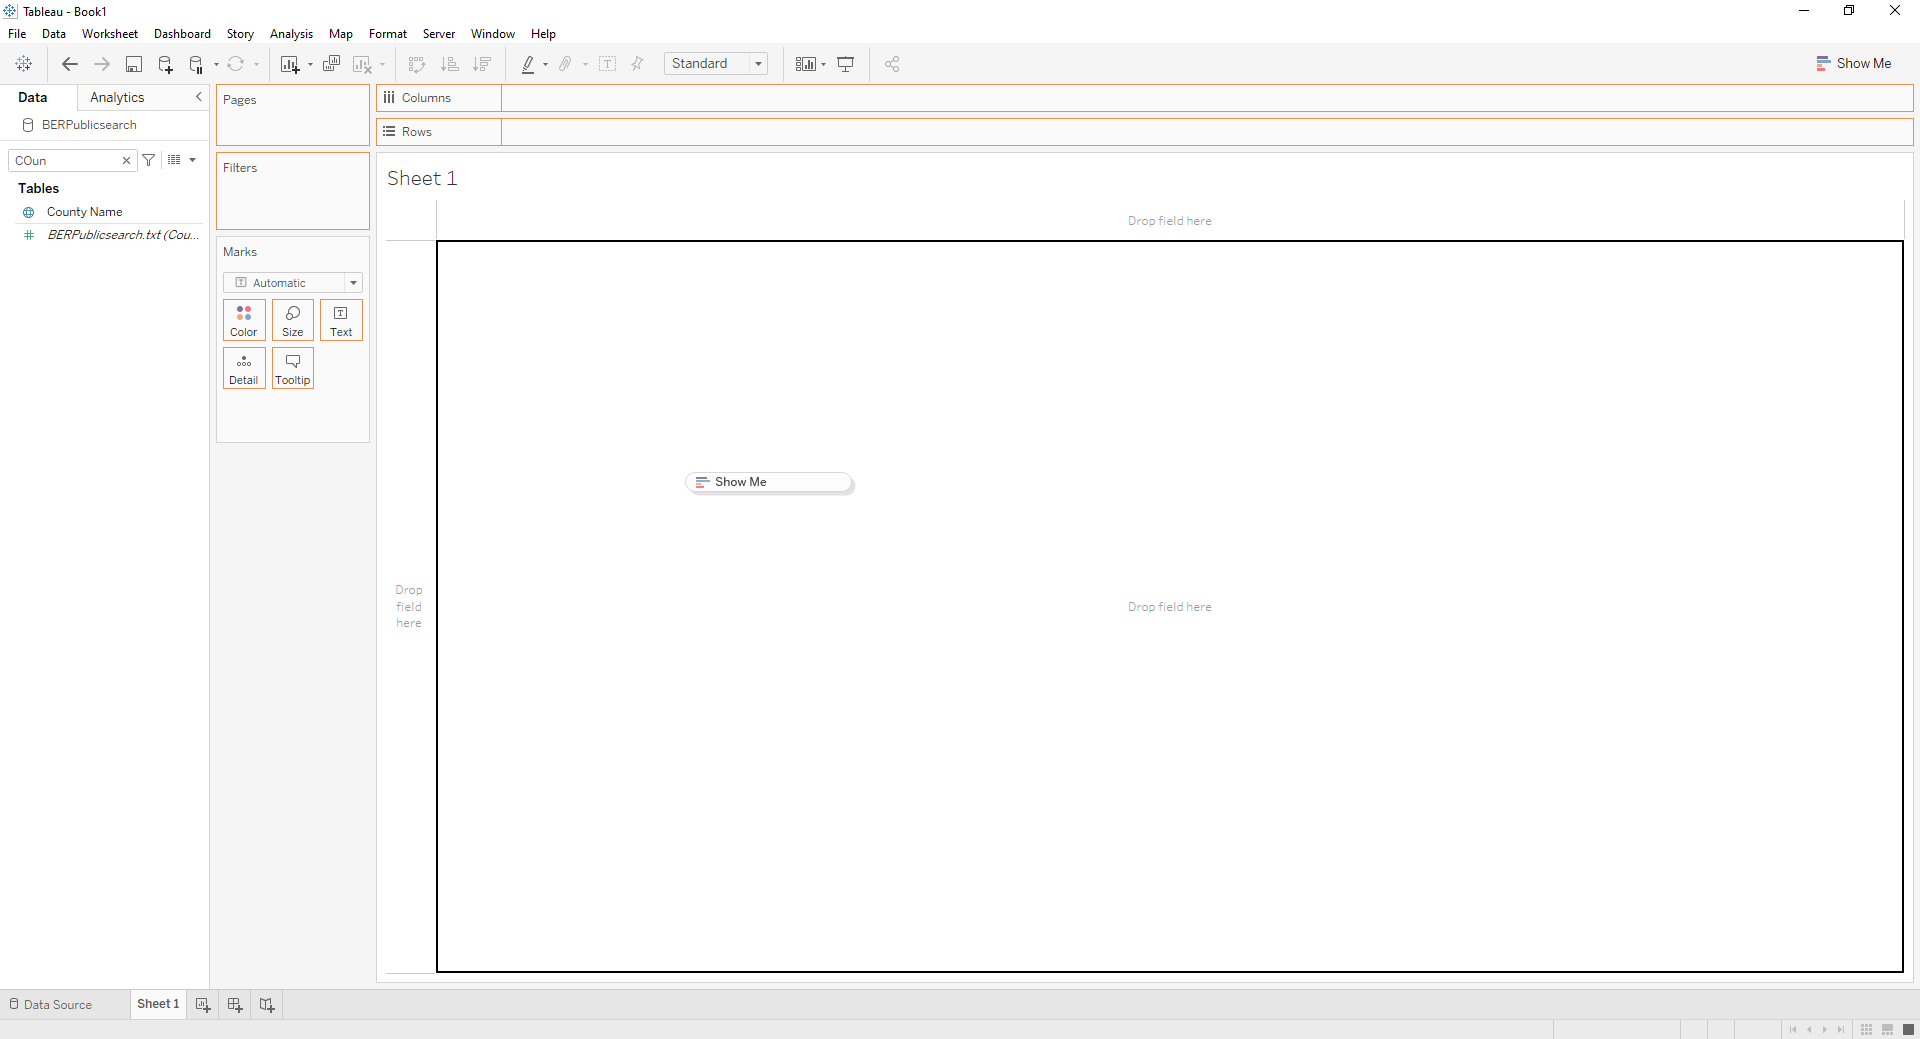
- In Sheet 1 or any new worksheet, find “CountyName” ( search function available ),drag and drop this onto middle of screen.
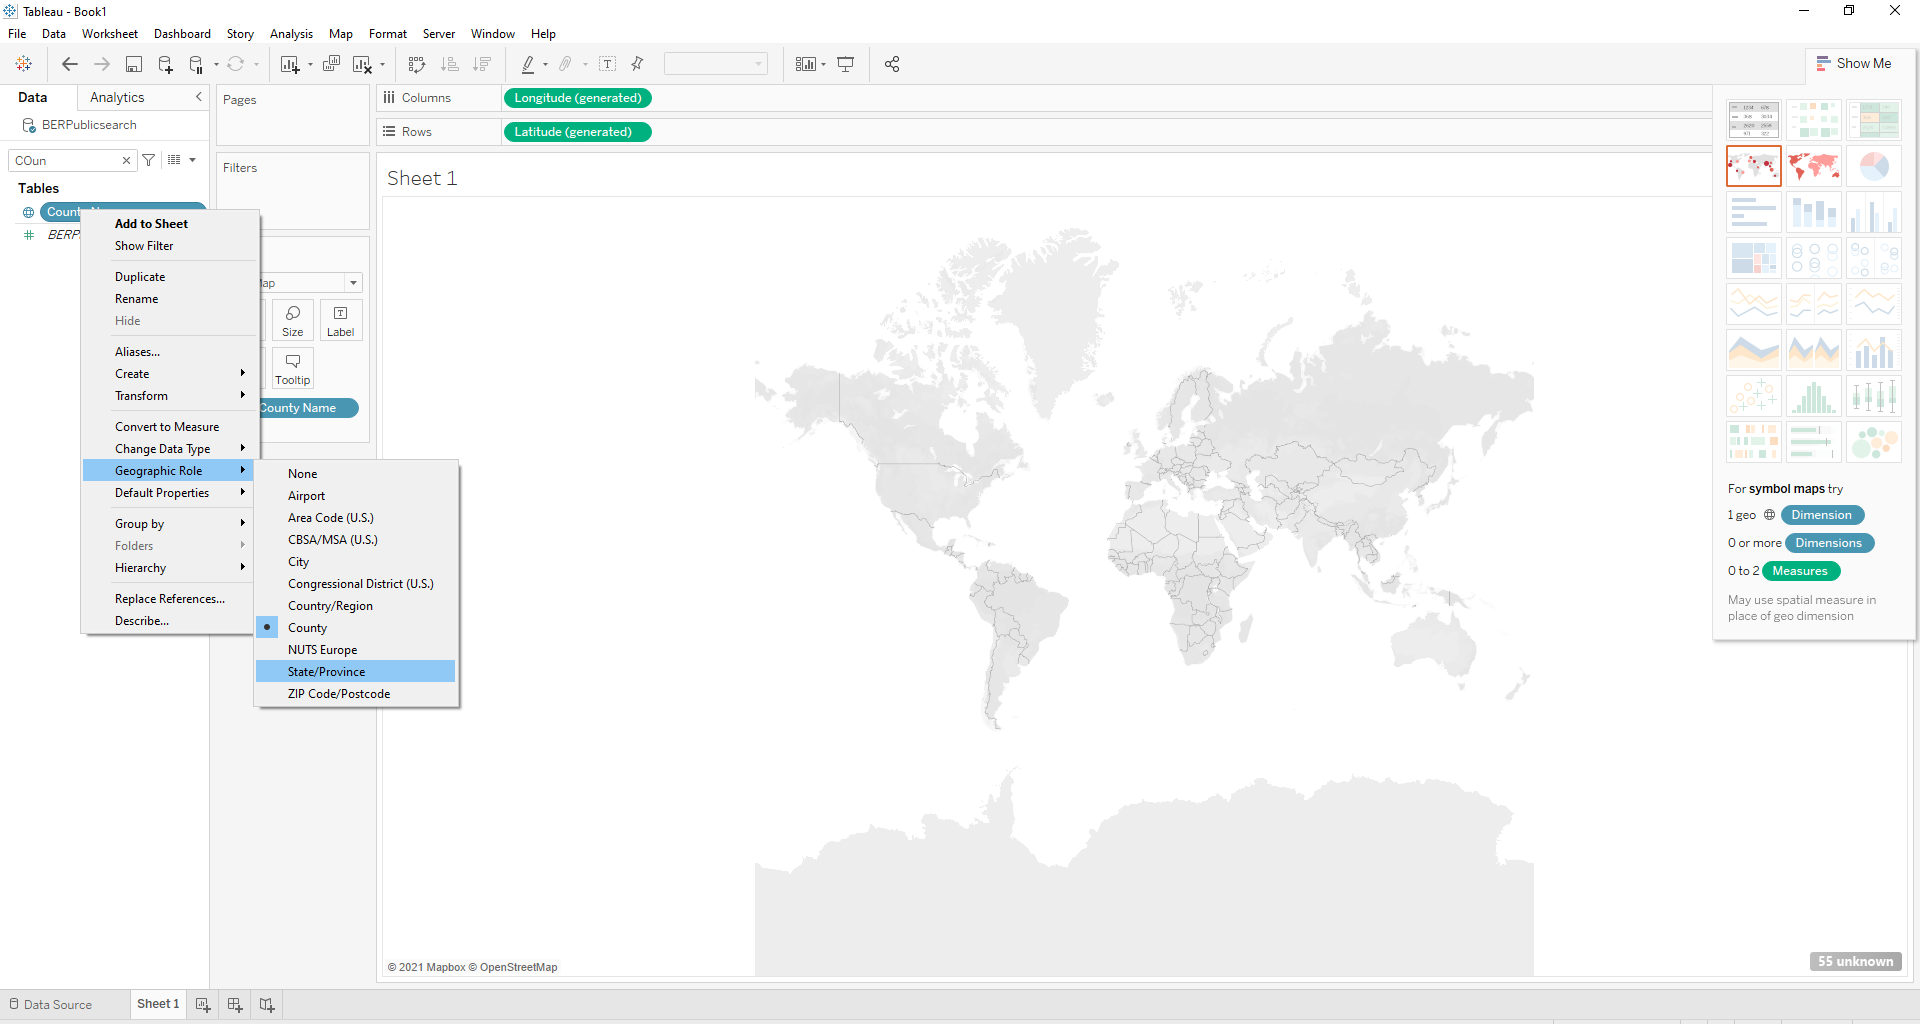
- There will be errors, to remove errors right Click CountyName and select Geographic role , then select State/Province.
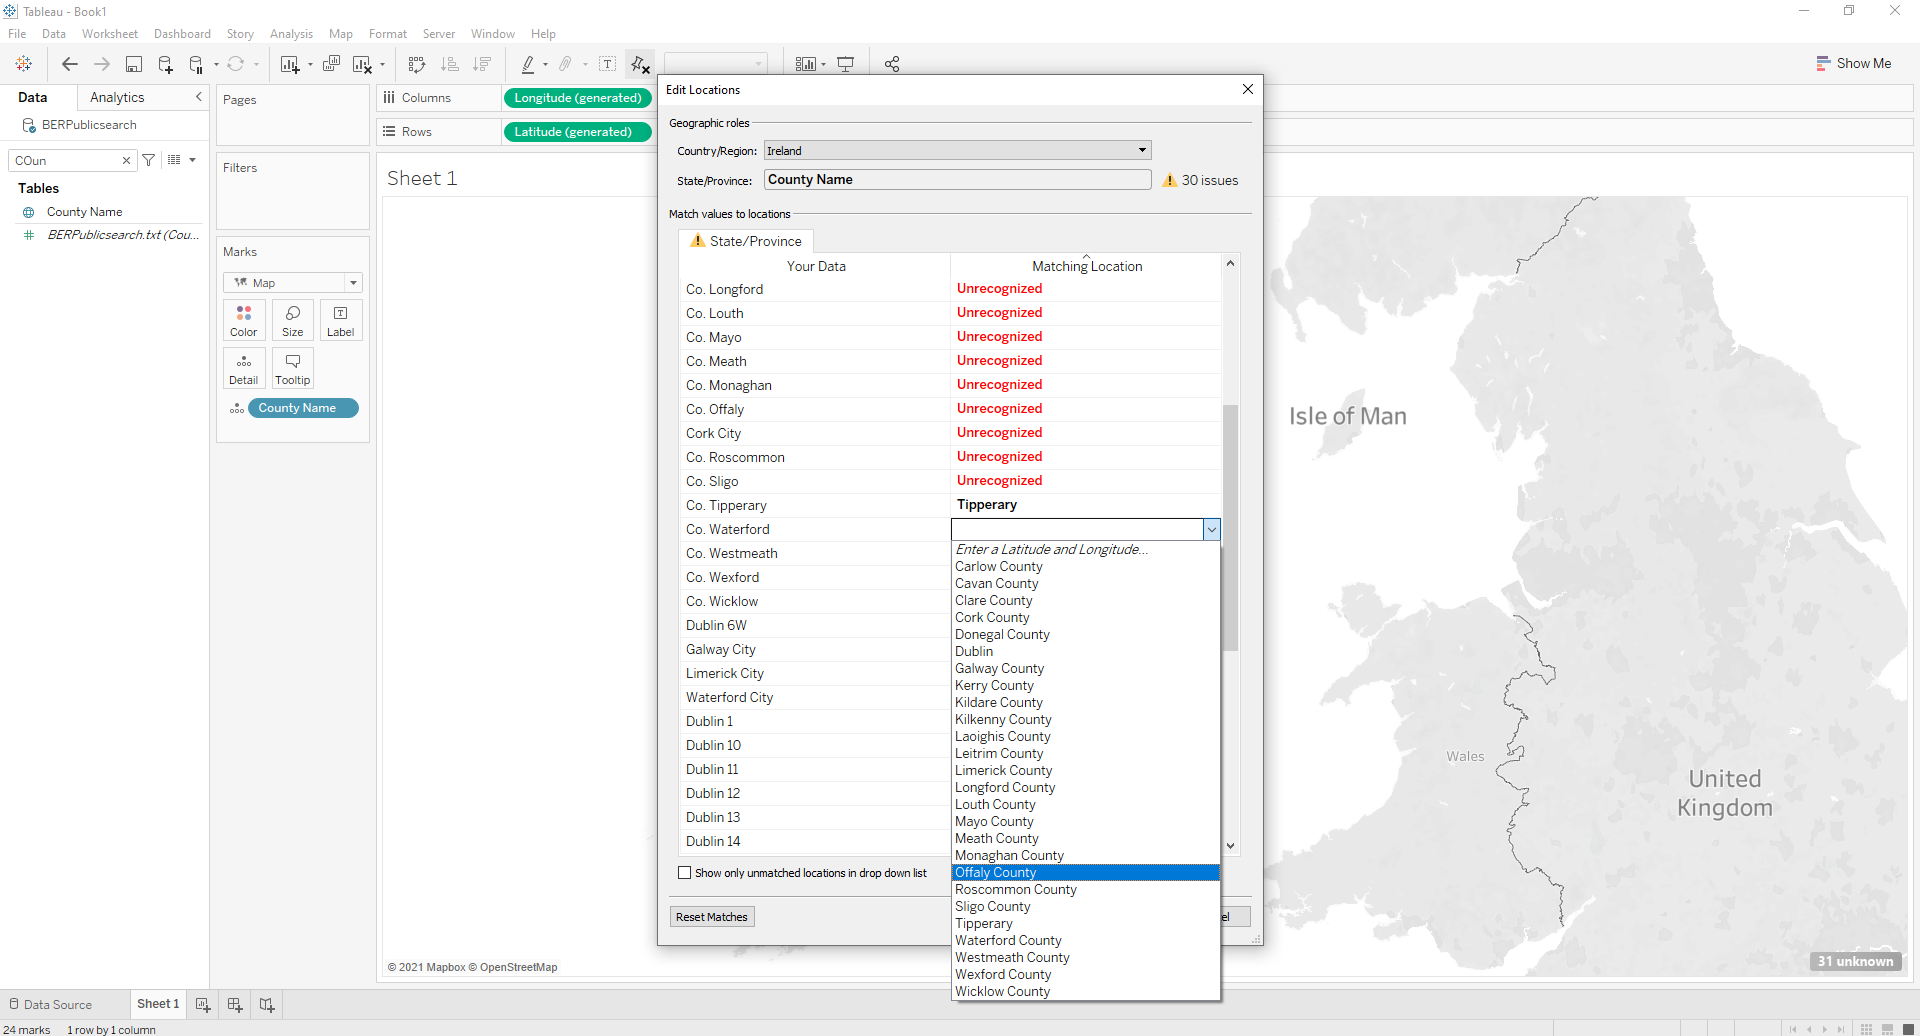
- There will be some errors left, to remove the remaining errors, click on the bottom right of the map click on the errors and select edit location ( or right click on Map and select edit location ). Then map the BER area name ( Dublin Postcode, City or County ) to the Tableau recognized county. Once complete all errors disappear.
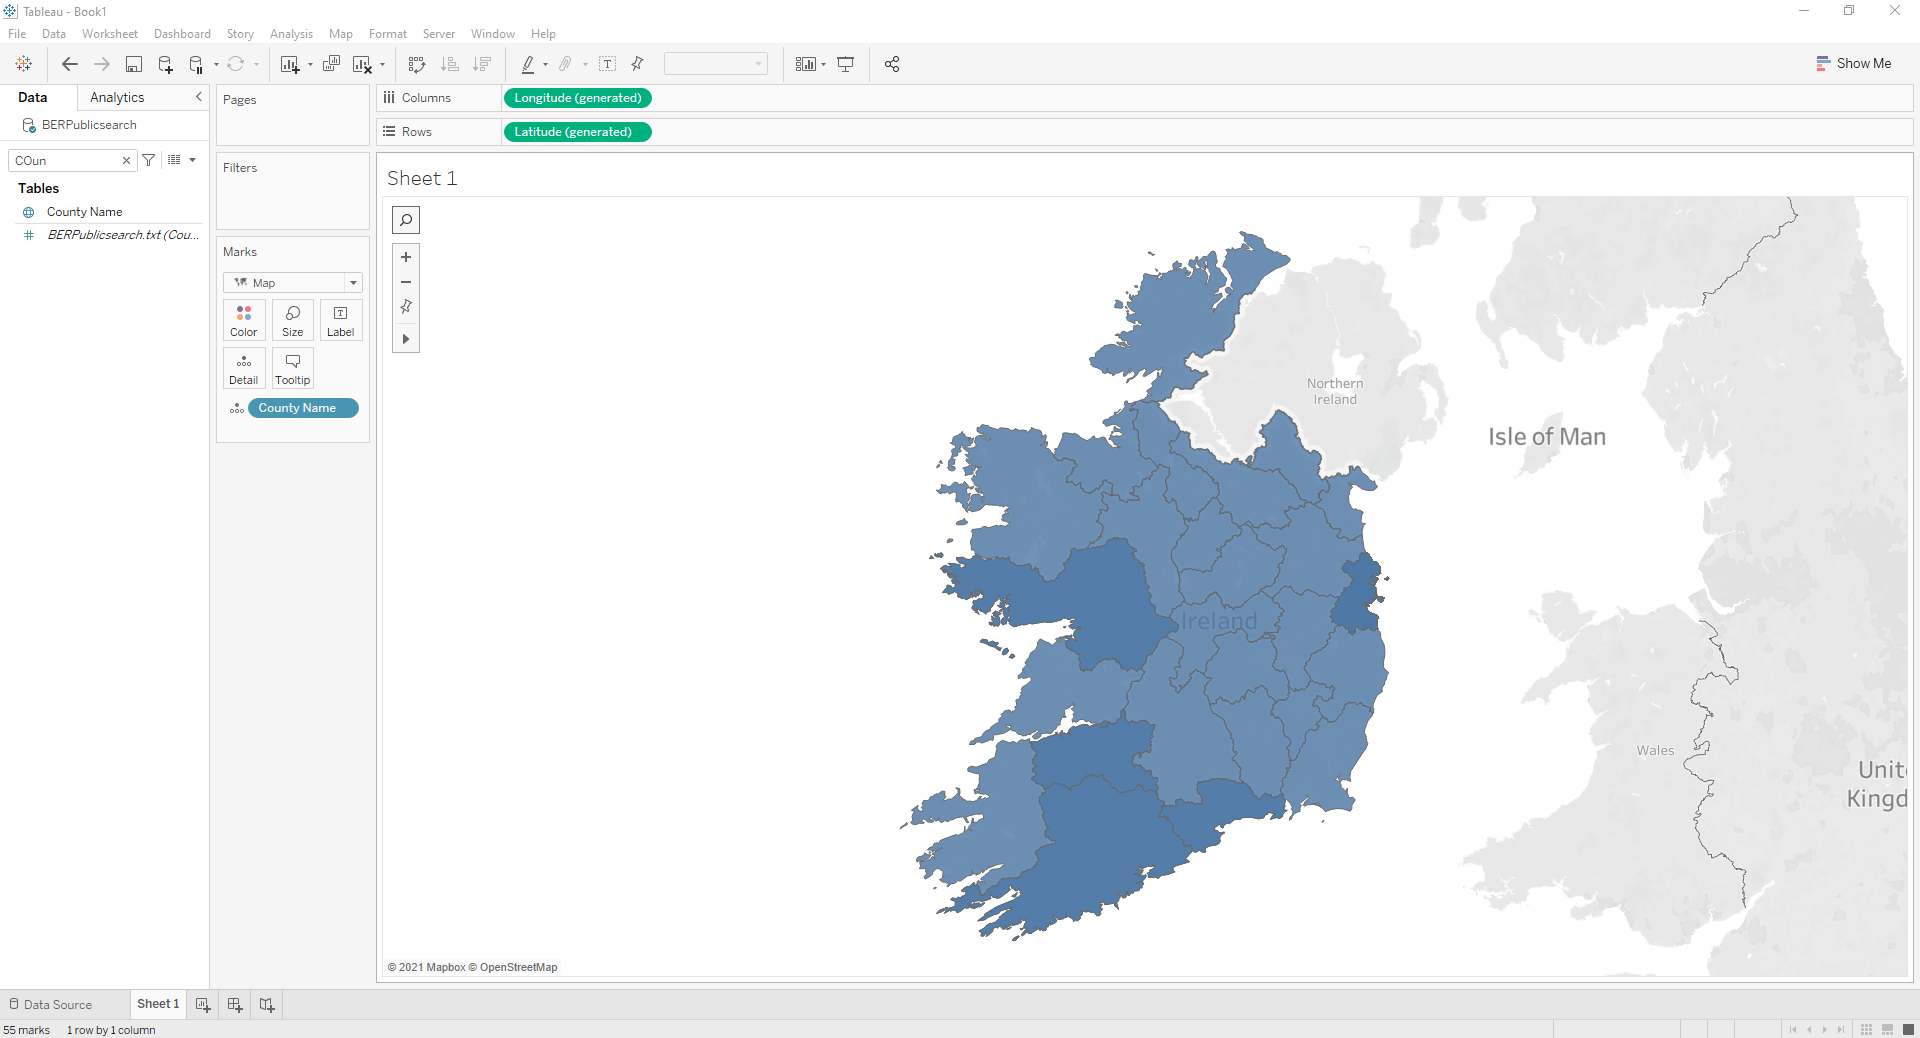
- On the top right of the screen select Show Me and then select Maps.
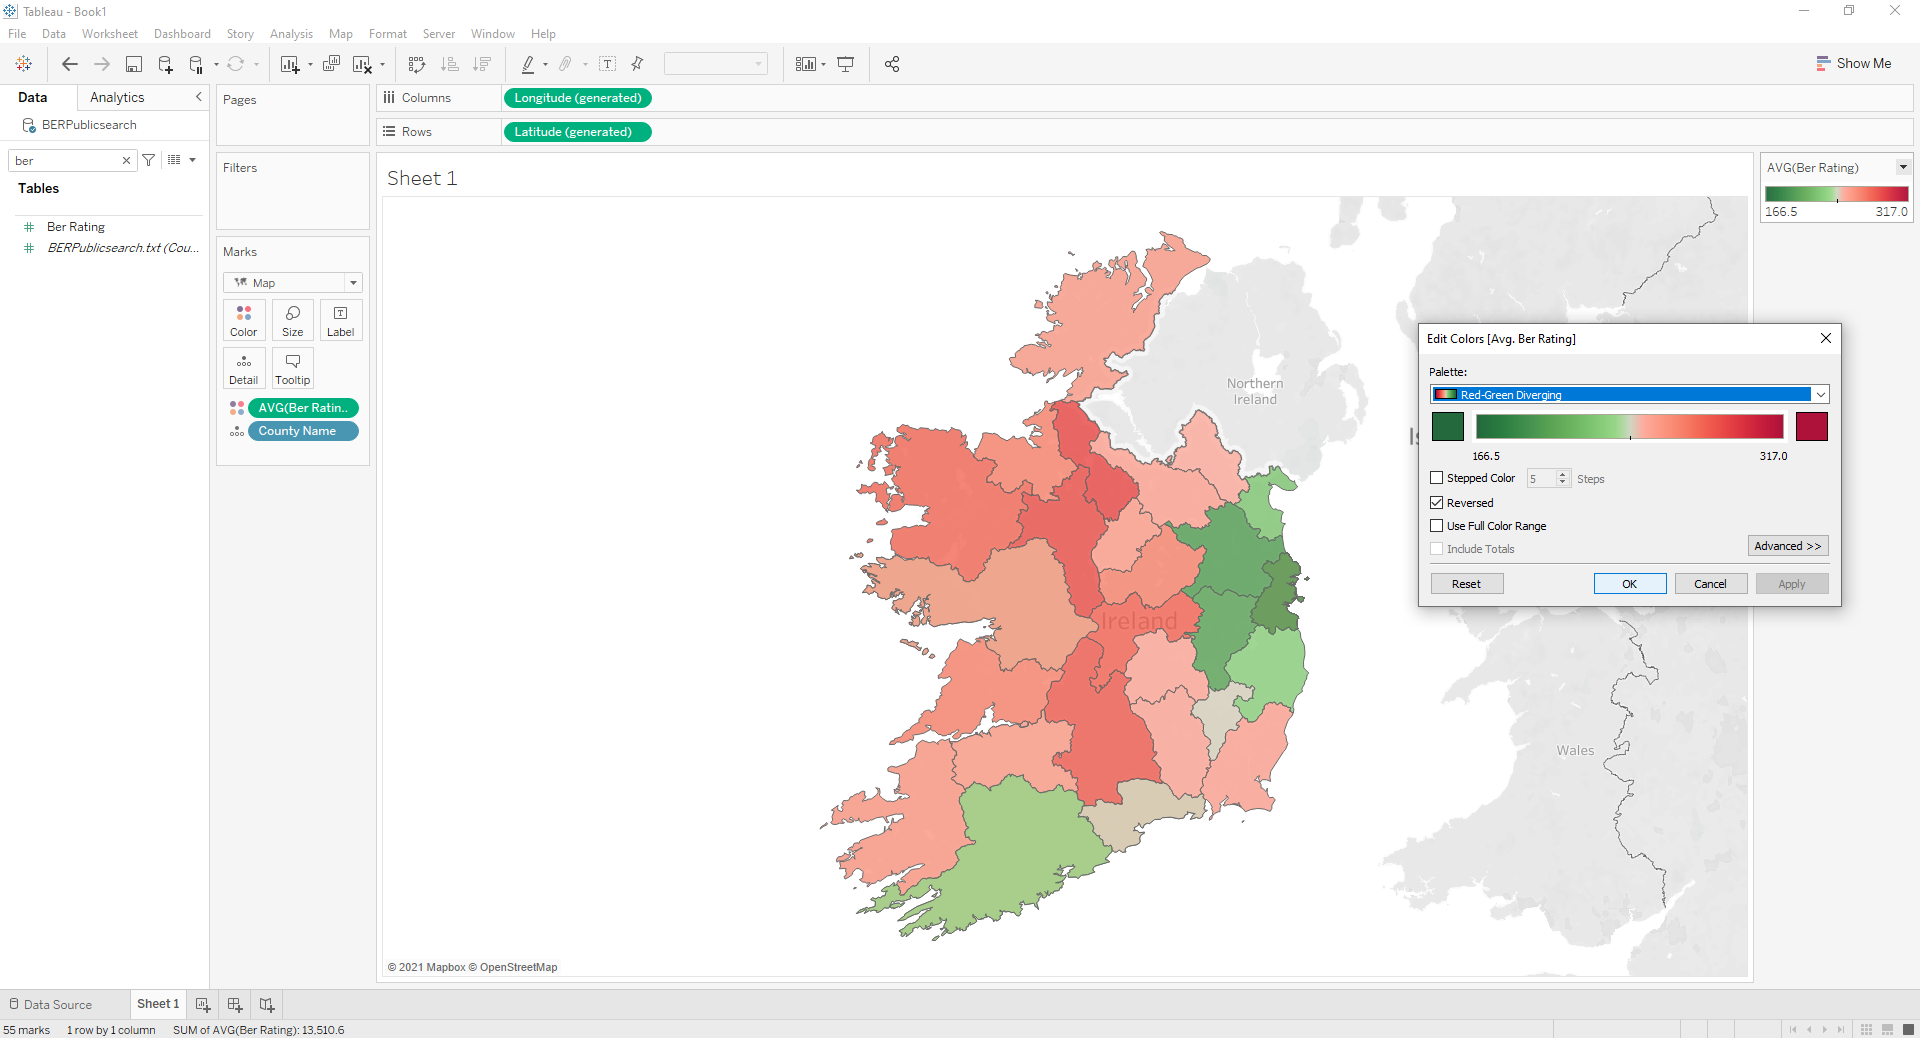
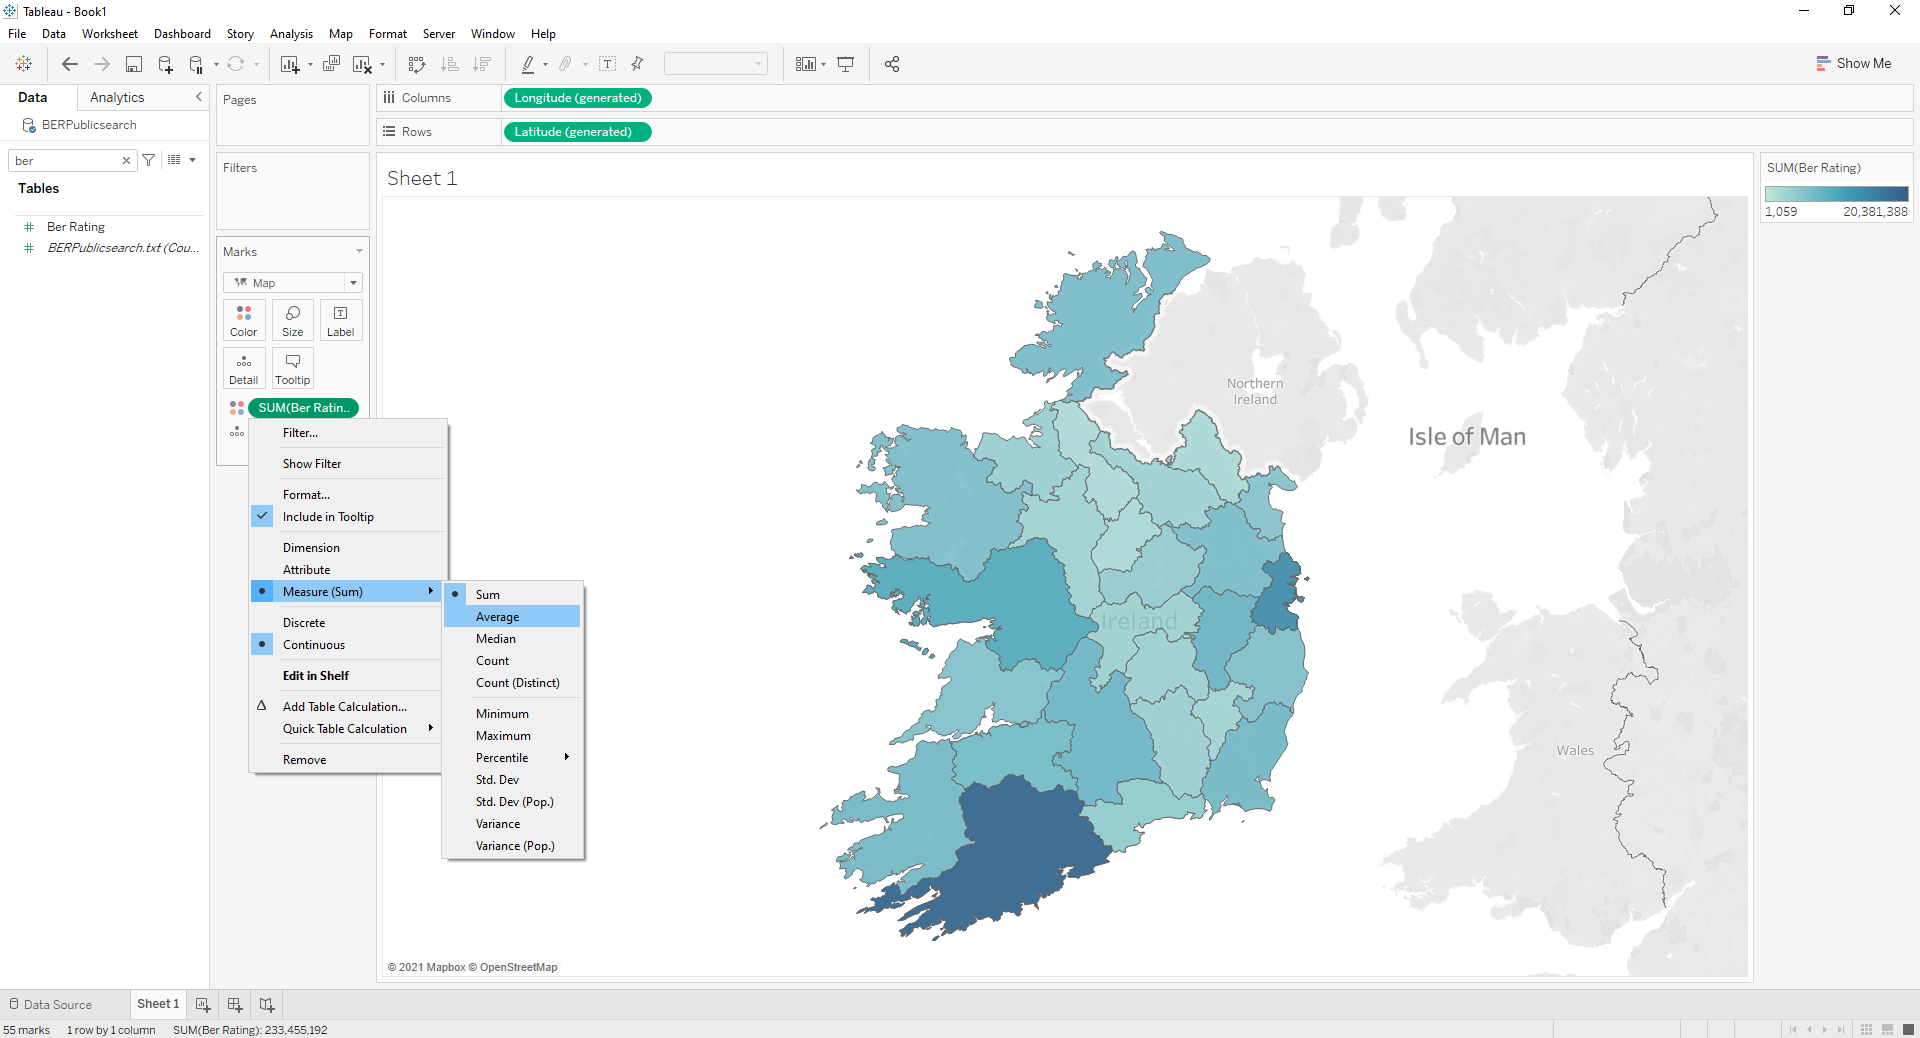
- Now the Map is complete and all the data is ready to be explored, An example below selects the BER rating ( kWh/m2/yr) drags and drops to color under marks and then right click and change from sum to average.
- Result, showing county and average BER value for that county:
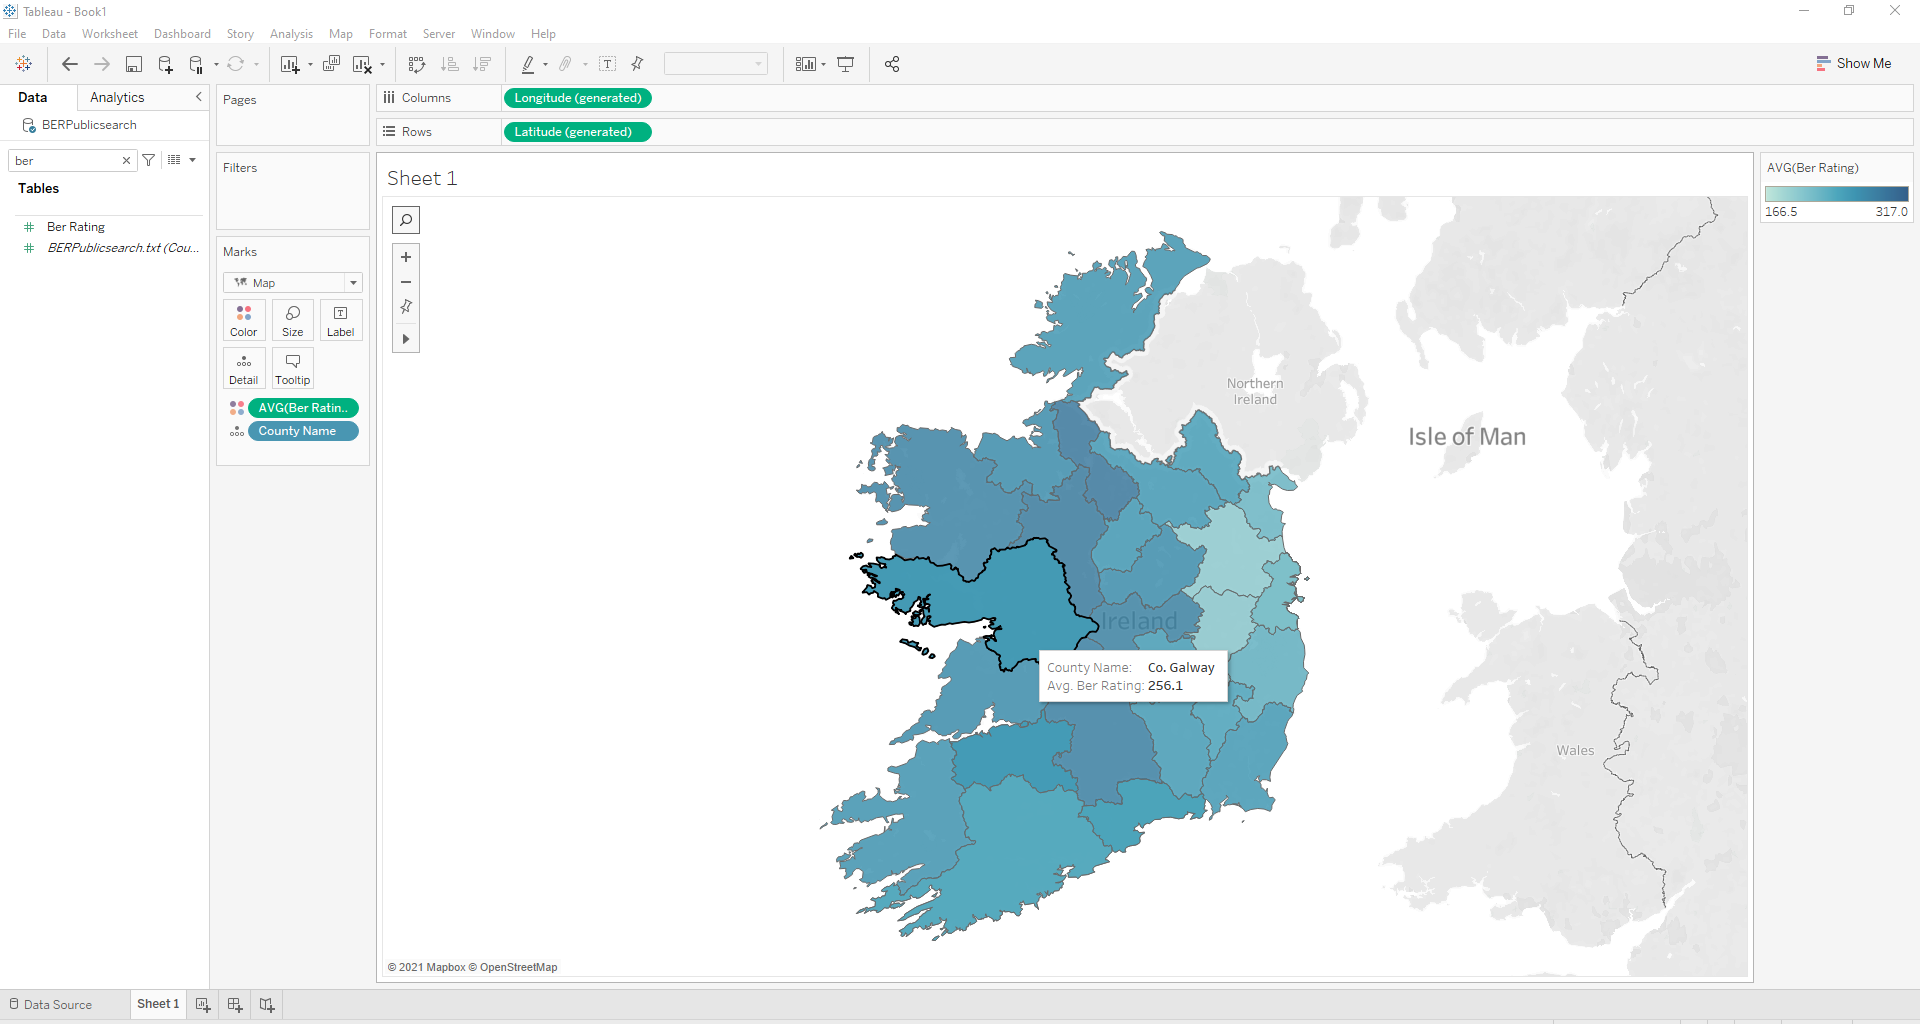
- And now for the cherry on top! Edit color on top right, to make the differences stand out. Colored Result: